
Q l - 2026 Wrap Up
A Structural Lens to Understanding the Current Environment
Markets entered 2026 on weaker footing, with the S&P 500 declining approximately 7.5% during the first quarter. The primary catalyst was not a deterioration in economic fundamentals, but a sharp rise in geopolitical tensions—particularly in the Middle East—which drove a surge in oil prices and reignited inflation concerns. As energy costs moved higher, markets were forced to reprice the path of interest rates, leading to a broad-based pullback across risk assets.
To better understand what the current environment may imply going forward, it is useful to step back and evaluate conditions through a longer-term structural lens—drawing on several complementary schools of thought that, while developed independently, converge on a similar interpretation of the present moment. The U.S., and the global system more broadly, appear to be transitioning into a new phase marked by the convergence of cycles, shifting geopolitical dynamics, and a more fragmented social and political backdrop.
Our thesis is that the period ahead is unlikely to resemble the clean, trend-driven markets of the past decade. Instead, it is more likely to be defined by elevated volatility, shorter cycles, and wider swings across asset classes. Taken together, these frameworks suggest that the years ahead—potentially extending into the early 2040s—will present a more dynamic and less forgiving investment landscape.
In this environment, success is less about passive exposure to broad market trends and more about understanding the underlying forces shaping outcomes—namely liquidity, policy, demographics, and social dynamics.
The Fourth Turning and the Friedman Framework: Converging Cycles
Over the past several years, Avondale has closely followed two foundational works on long-term cycles: The Fourth Turning, developed by William Strauss and Neil Howe, and The Next 100 Years by George Friedman. The Fourth Turning presents an 80–100 year generational cycle, or saeculum, composed of four distinct phases or “turnings”, each lasting roughly 20 years and defined by shifts in social mood. The First Turning, or High, is characterized by strong institutions and subdued individualism; the Second Turning, or Awakening, brings cultural and spiritual upheaval as the prevailing order is challenged; the Third Turning, or Unraveling, sees institutions weaken while individualism rises; and the Fourth Turning culminates in a period of crisis, where institutional structures are fundamentally reshaped and societal priorities are reset. Historically, this final phase has been marked by economic strain, political friction, and heightened geopolitical conflict, ultimately giving way to a new civic order.
In parallel, Friedman outlines two recurring structural forces: an approximately 80-year institutional cycle and a 50-year socioeconomic cycle. The institutional cycle describes the rise and eventual breakdown of a nation’s core systems—political, economic, and social—which are born out of crisis, expand into dominance, grow increasingly rigid, and are ultimately restructured through a subsequent disruption. The socioeconomic cycle, operating on a shorter horizon, reflects the evolving balance between growth and social stability, as periods of broad prosperity give way to rising inequality, mounting strain, and eventual policy or systemic adjustment that resets the cycle.
What is notable is that both frameworks independently point to the current period—the 2020s into the 2030s—as a window in which these cycles converge and transition. With that context in place, it is instructive to look back at prior cycle endpoints to better understand how markets behaved under similar conditions. The last major Fourth Turning and institutional reset culminated at the end of World War II in 1945, while the most recent socioeconomic reset unfolded during the late 1960s through the 1970s. The parallels between that era and today are both striking and informative.
Parallels 1949–1980 to the Modern era 2009-Today
1. Financial Repression and Debt Build-Up
One of the strongest parallels to the modern era lies in the monetary backdrop preceding the last socioeconomic cycle of 1966–1980. In the aftermath of World War II, the global economy faced a difficult reality. Labor markets were disrupted, capital stock was impaired, and governments were left with significant debt obligations. Rather than defaulting, policymakers turned to financial repression as a solution.
This approach involves deliberately holding interest rates below the rate of economic growth. When growth exceeds yields, debt becomes more manageable—not because it is being repaid, but because inflation erodes its real value over time. This is not the result of fiscal discipline or budget surpluses. It is the quiet mechanism of currency debasement, allowing governments to reduce their debt burden while shifting the cost indirectly onto the public.
This policy regime persisted through the 1950s and into the 1960s. However, as the system matured, the underlying imbalances began to surface. The effects of prolonged monetary accommodation became increasingly visible manifesting in inflation shocks, geopolitical strain, social unrest, and ultimately the collapse of the Bretton Woods monetary system, which had anchored global currencies to the dollar and the dollar to gold.
A similar structure emerged in the modern era. Following the 2008 financial crisis, markets experienced prolonged periods of suppressed interest rates, aggressive central bank intervention, and significant balance sheet expansion. Debt levels expanded across both public and private sectors, while monetary policy was used to maintain stability. In this environment, artificially low rates did more than support the economy—they pushed investors out the risk curve, inflating asset prices and driving a prolonged expansion in equity markets.
The first cracks began to appear in 2018, when the Federal Reserve attempted to tighten policy through rate hikes and balance sheet reduction, leading to a sharp market selloff. In 2019, the repo market disruption provided a more direct signal that the system had become dependent on liquidity. This ultimately culminated in the COVID shock, where massive quantitative easing and fiscal expansion flooded the system with liquidity and reset the cycle.
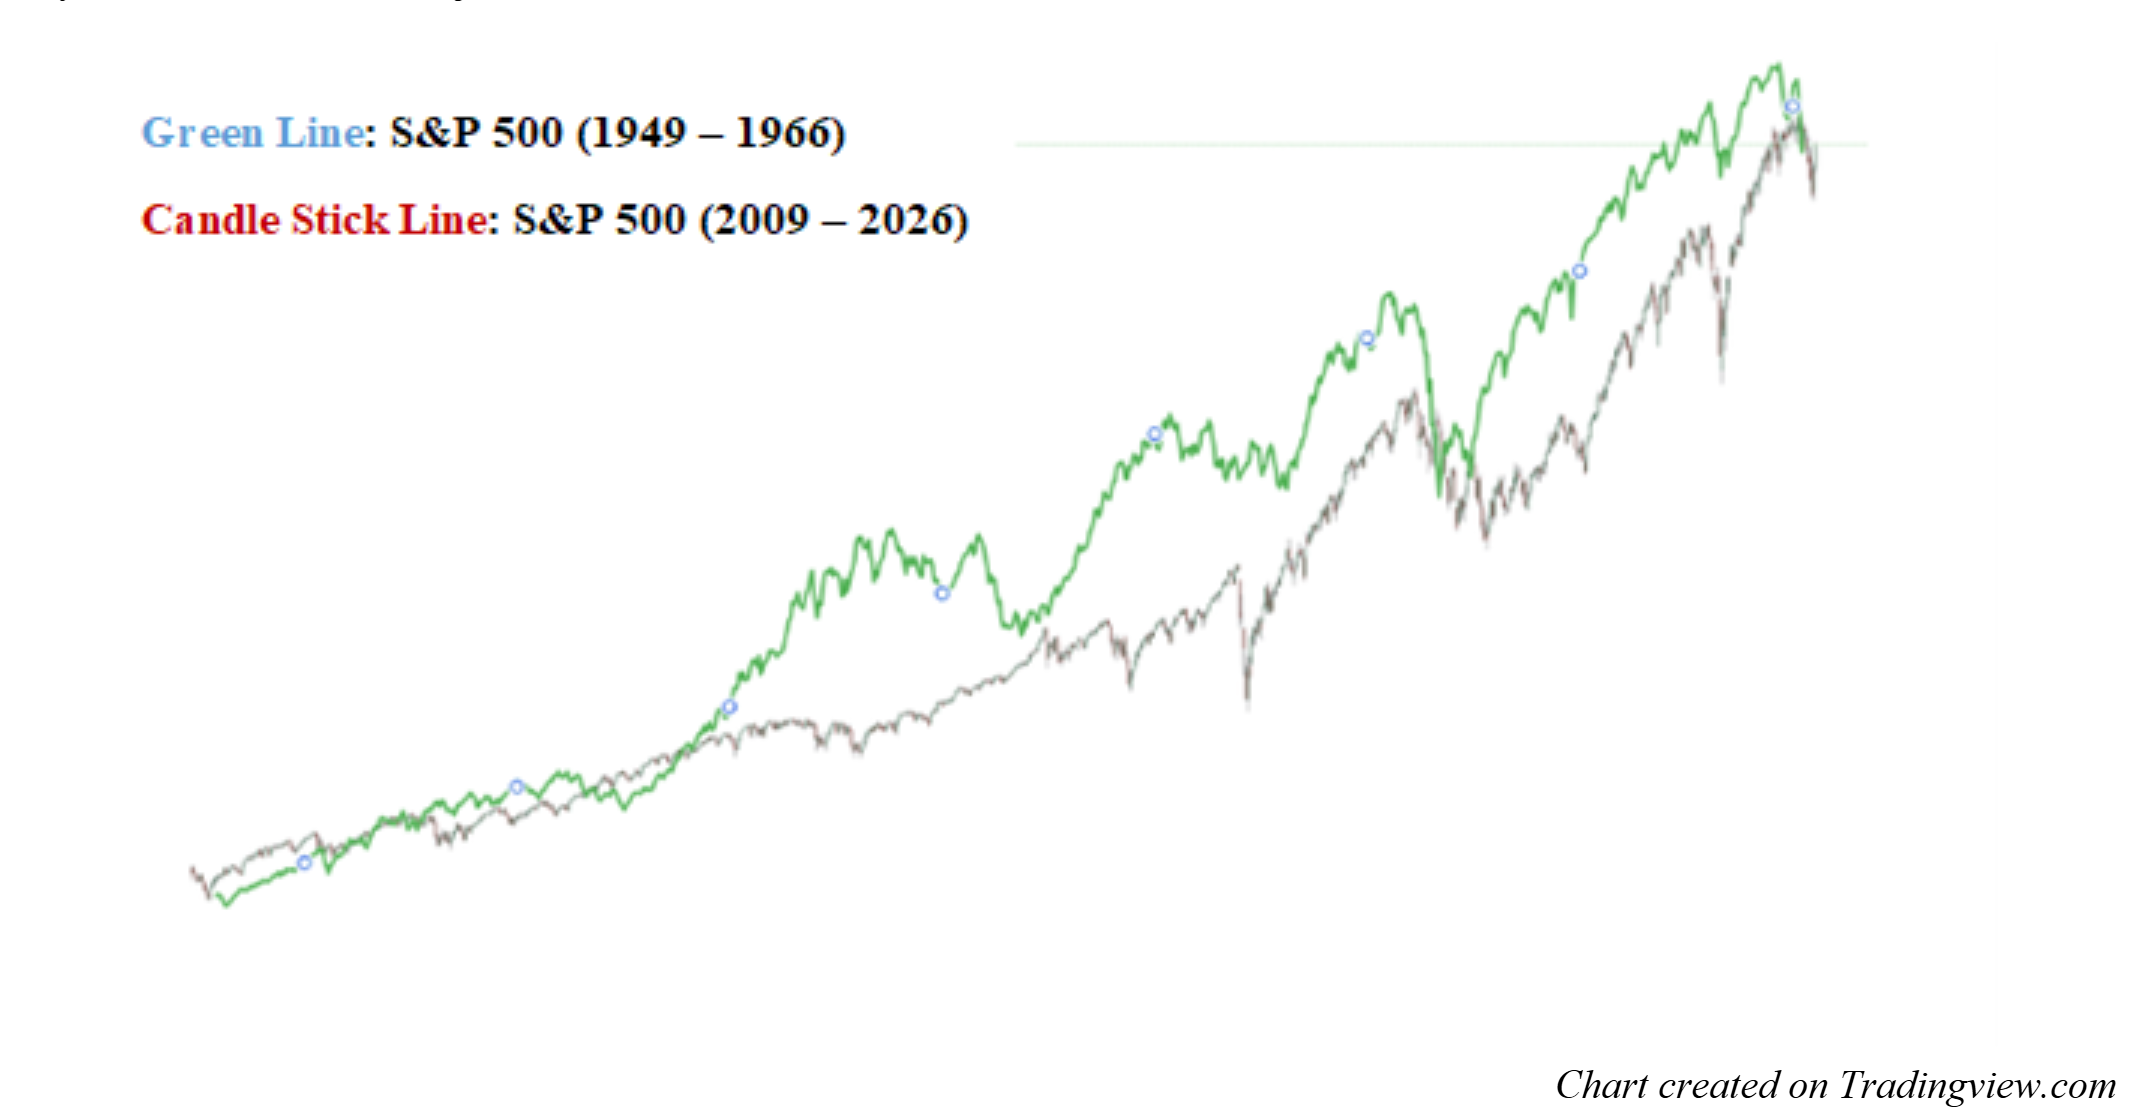
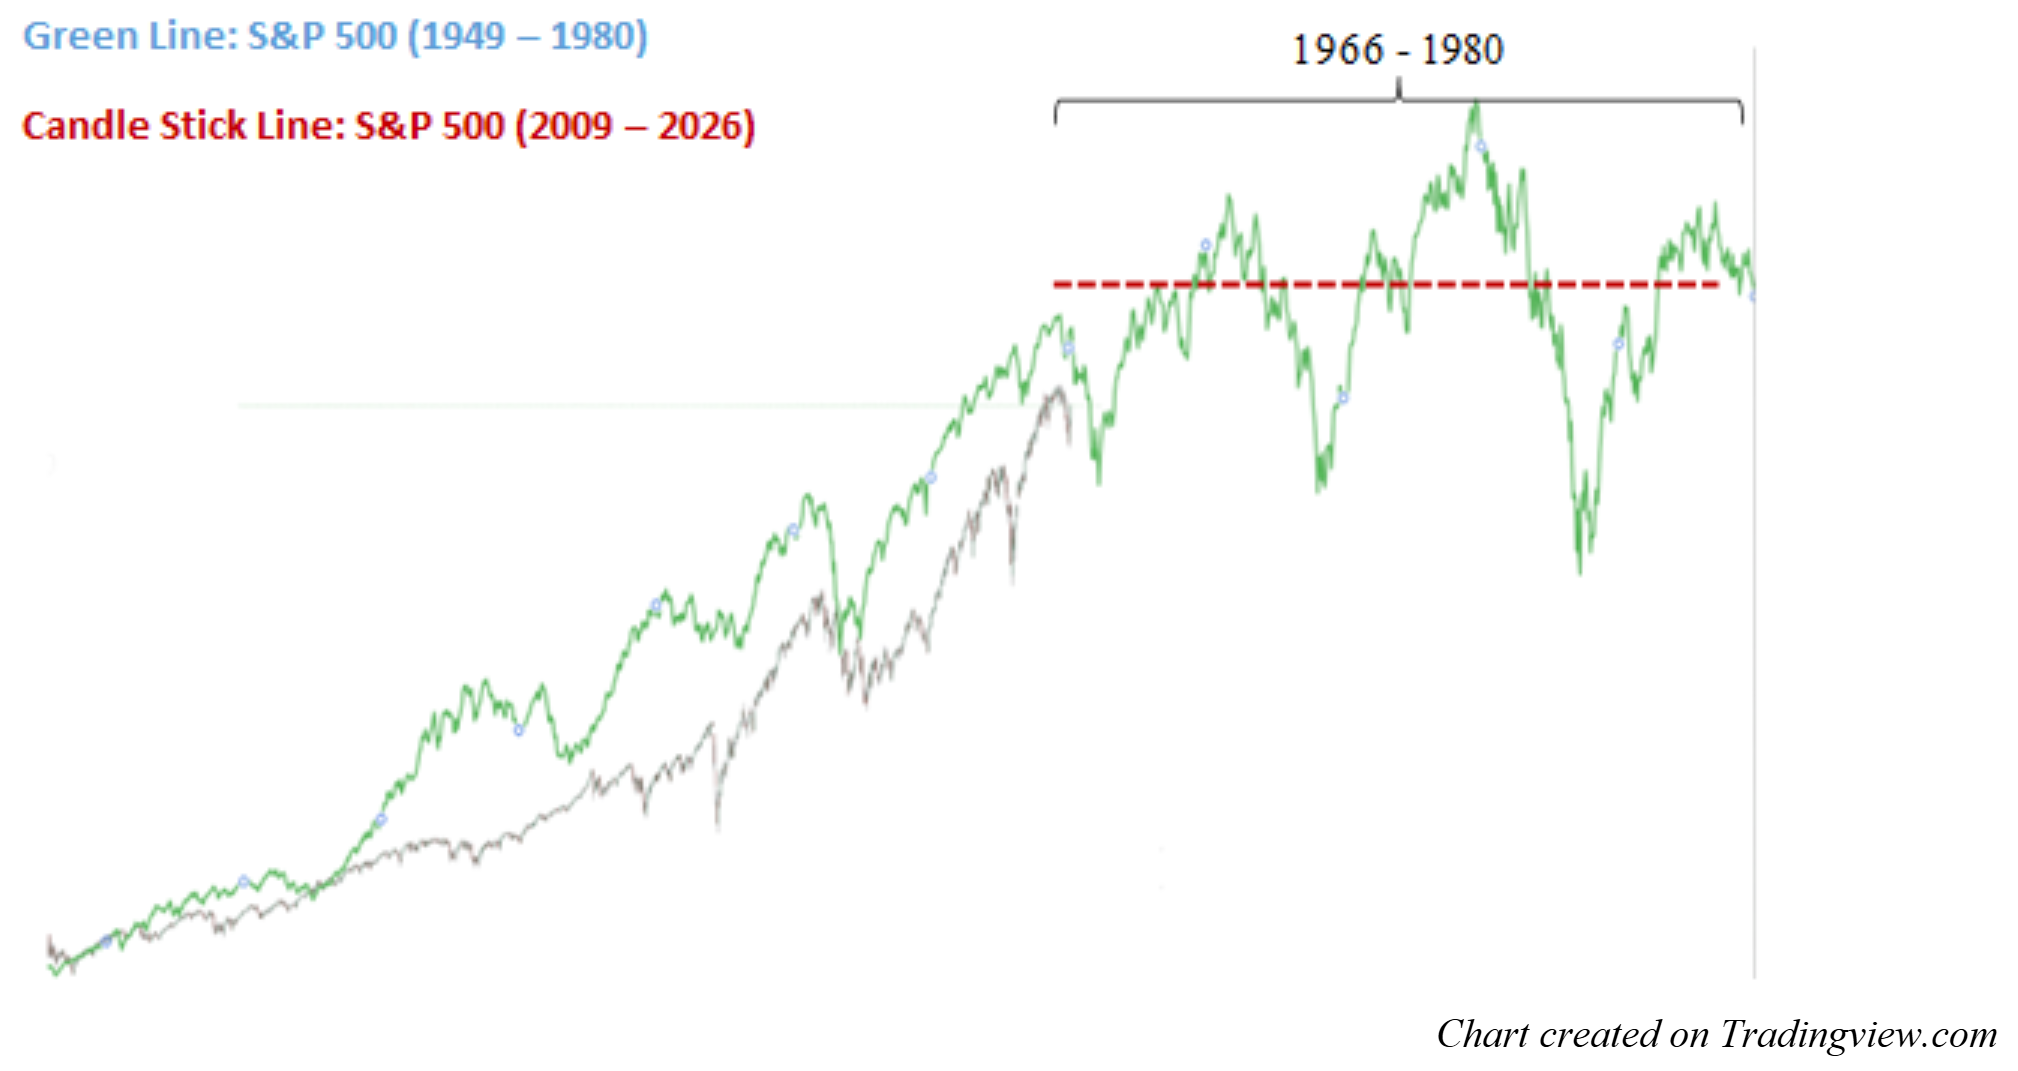
The chart below highlights this dynamic. The S&P 500 from 1949 to 1966 is overlaid with the period from 2009 to 2026. In both cases, the relationship is clear: prolonged periods of suppressed rates and policy support coincide with sustained asset price appreciation, masking underlying structural fragility until the system is forced to adjust.
2. Inflation as the Breaking Point
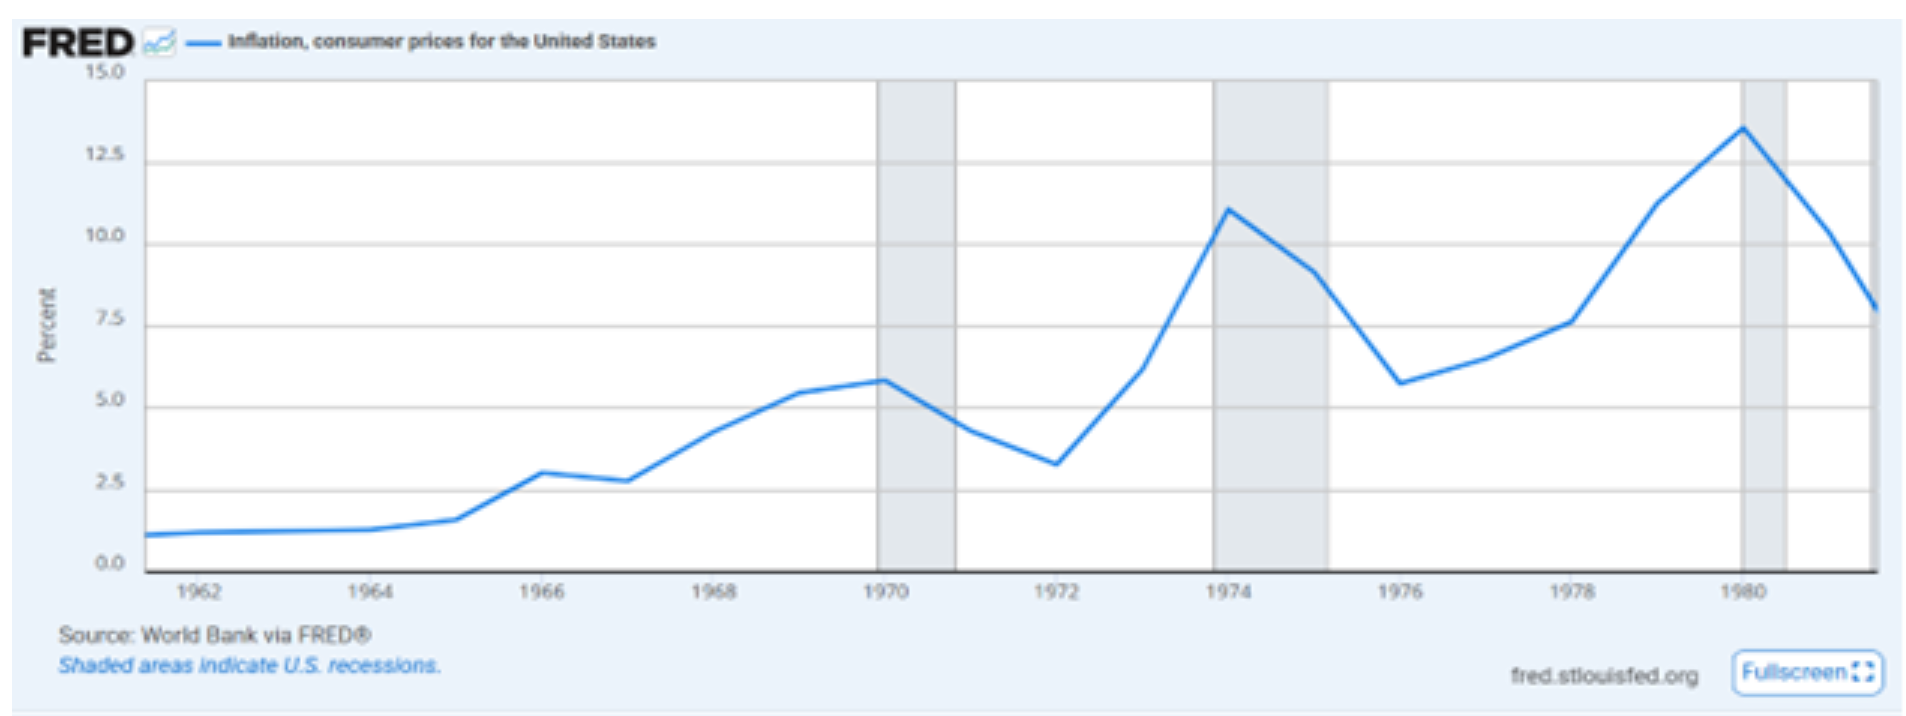
Following the period of financial repression in the 1950s and early 1960s, the effects of suppressed interest rates and sustained policy intervention began to surface. By 1965, inflation had shifted from a stable, cyclical pattern to a more persistent, structural trend—marking the beginning of what is now referred to as the “Great Inflation.” This period coincided with the escalation of the Vietnam War and the rollout of Lyndon Johnson’s Great Society programs, both of which contributed to a sustained increase in fiscal spending. The result was a long-term rise in inflation that persisted through 1980 and ultimately required materially higher interest rates to bring under control.
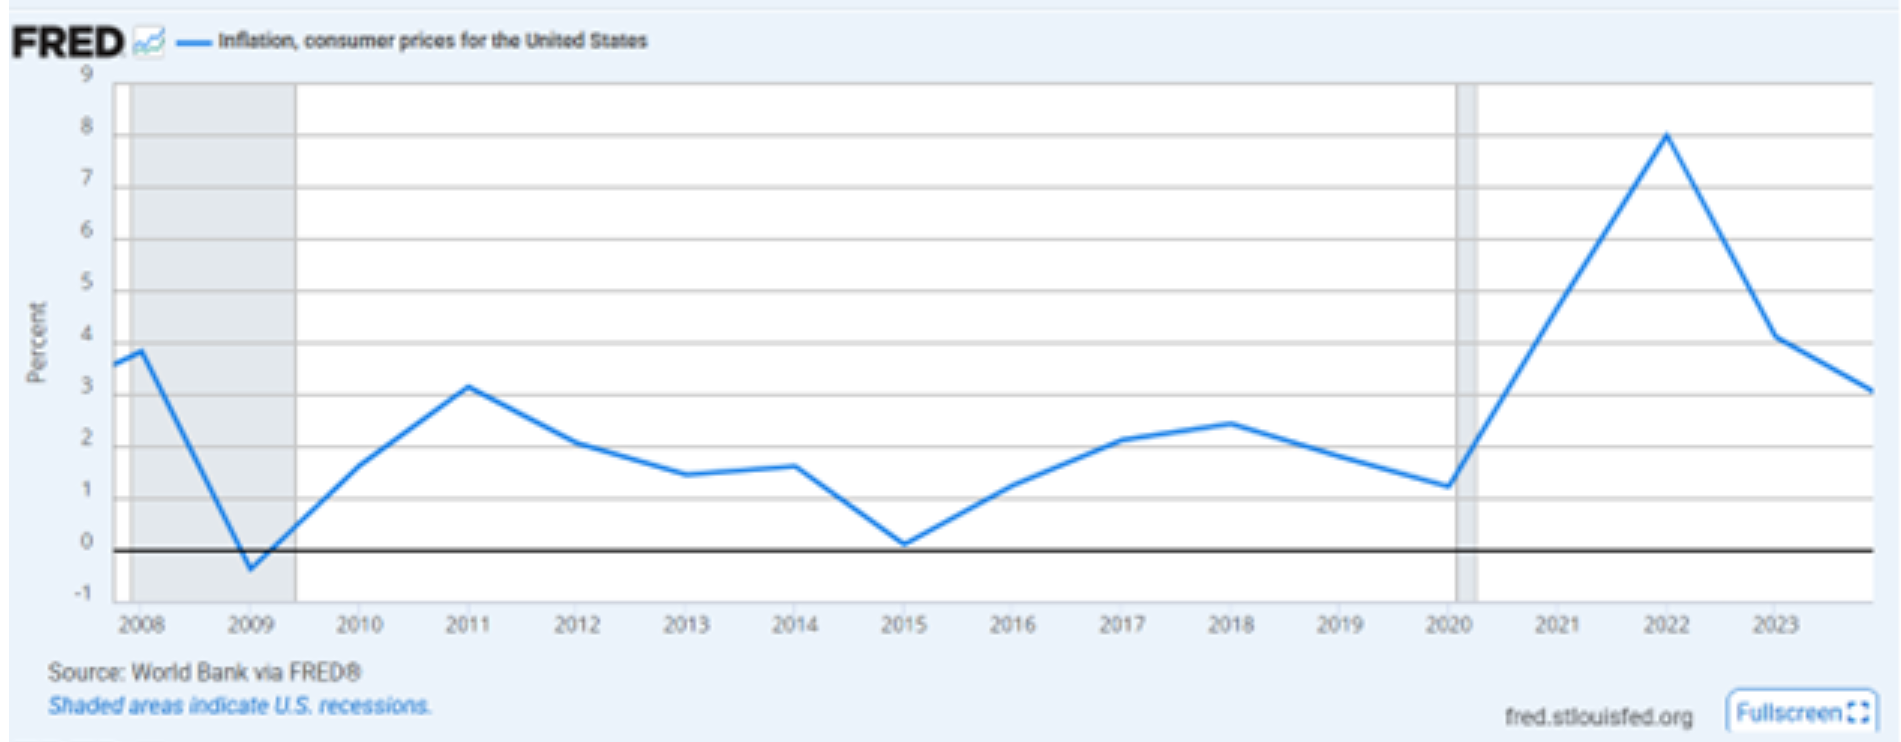
Today’s parallel is the post-COVID inflation shock of 2021–2022. While the magnitude and drivers are not identical, the pattern is similar: prolonged monetary accommodation gives way to inflation, forcing a repricing of assets, expectations, and policy. If this historical structure holds, the implication is not necessarily a straight-line rise in inflation, but rather a regime in which inflation proves more persistent, and interest rates remain structurally higher than those experienced in the prior decade.
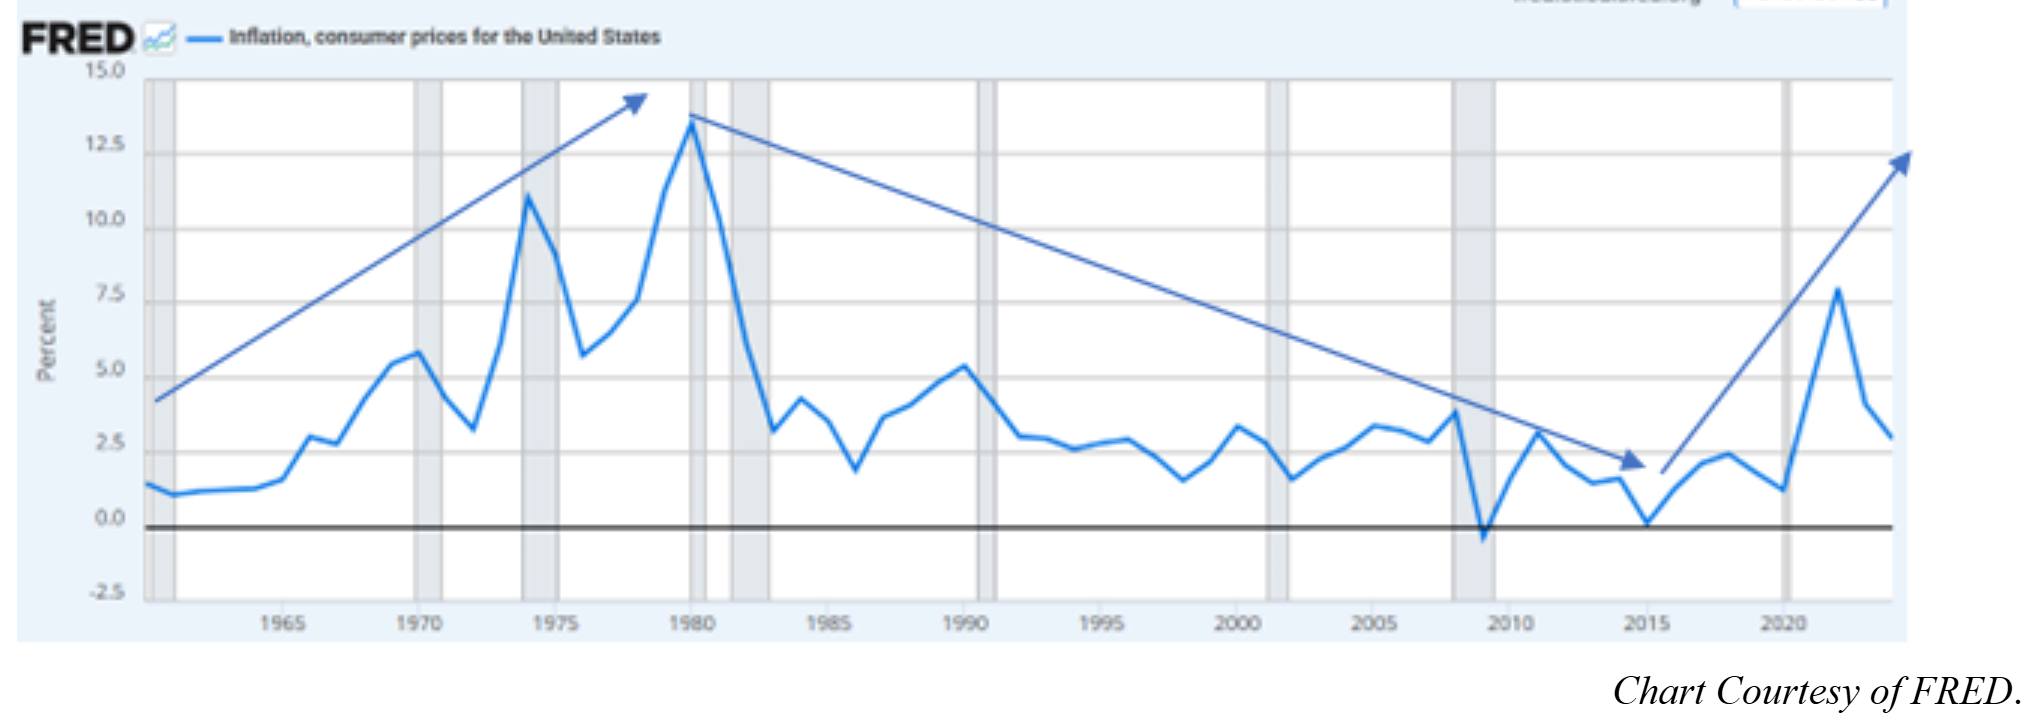
The three graphs below illustrate this dynamic. The first highlights the period from 1962 to 1980, where year-over-year inflation begins to accelerate around 1965 and did not peak until 1980. The second shows the modern period from 2009 to today. The third zooms out to capture the full arc from 1960 through the present, providing a broader view of how these regimes compare over time.
3. War and Global Strain
Simultaneous with the onset of the Great Inflation in the mid-1960s, geopolitical tensions escalated as the United States became increasingly involved in Vietnam. While U.S. engagement began earlier, the conflict intensified meaningfully in 1965, with troop deployments and sustained military operations ramping sharply and peaking around 1969. The roots of the war lay in the broader Cold War dynamic, as the U.S. sought to contain the spread of communism and maintain its position within the global order.
The consequences extended well beyond the battlefield. The war placed sustained pressure on fiscal resources, contributed to rising deficits, and amplified inflationary forces already building within the system. At the same time, it fueled social unrest at home and eroded public trust in political leadership—hallmarks of a system under strain.
Today’s geopolitical landscape is more fragmented and less defined by direct U.S. military involvement, but the underlying dynamics are familiar. The modern parallel can be seen in Russia’s invasion of Ukraine in 2022 and the immediate response from the United States and its allies through financial support, weapons, and intelligence. While the structure differs, the pattern is similar: a shifting global order, regional powers seeking to reassert influence, and major economies becoming entangled—directly or indirectly—in prolonged conflict.
The implication is consistent across both periods. Extended geopolitical tension places pressure on fiscal systems, reinforces existing economic imbalances, and challenges institutional credibility—particularly as these dynamics emerge late in broader economic and political cycles.
4. Oil Shocks and Monetary System Stress
By the early 1970s, rising geopolitical tensions spilled into the Middle East with the onset of the Yom Kippur War in 1973. As the United States backed Israel, Arab nations—acting through OPEC—responded by imposing an oil embargo on the U.S. and its allies. The result was the oil crisis of 1973–74, which led to a sharp surge in energy prices and the now-iconic fuel shortages and long gasoline lines. What had been a manageable inflation problem quickly became a systemic challenge, as energy costs fed directly into broader price pressures across the economy.
Today, a similar dynamic is beginning to emerge. Conflict involving Israel and Iran, combined with increasing U.S. involvement, has once again placed the Middle East at the center of global energy risk. Disruptions to key supply routes, most notably concerning the Strait of Hormuz, have driven oil prices higher, reinforcing inflationary pressures in a system still adjusting to the after effects of the COVID-era shock. While the scale and structure differ, the pattern is familiar: geopolitical conflict acting as a catalyst that amplifies underlying economic fragility.
Simultaneous to the energy shocks of the 1970s, the global monetary system was undergoing a fundamental transformation. The Bretton Woods system—established after World War II and designed to anchor global currencies to the dollar, and the dollar to gold—began to unravel when the United States ended dollar convertibility into gold in 1971. By 1973, the broader system of fixed exchange rates had collapsed. This was not merely a technical adjustment, but a regime shift that reshaped the global financial order.
In the aftermath, the world transitioned to a fiat, dollar-based system with floating exchange rates, a framework that remains in place today. However, like the early 1970s, that system is once again showing signs of strain. This time, the pressure stems from elevated global debt levels, shifting reserve preferences, and the evolution of financial infrastructure. Debates surrounding sanctions, payment systems, digital currencies, and sovereign monetary policy all point to a system in flux. The endpoint remains uncertain, but the direction is clear: the current monetary architecture is being tested and reshaped.
5. Institutional Distrust, Fragmentation, and Cultural Signals
The final piece of this framework lies in the broader social mood and cultural signals that tend to emerge at the end of major cycles. Both Strauss & Howe and George Friedman arrive at a similar conclusion: these periods are defined by peak internal tension, where trust in institutions erodes, political and cultural divisions intensify, and society begins to fragment along ideological lines.
In The Fourth Turning, Strauss and Howe describe this phase as one in which the existing order is no longer viewed as legitimate and the civic fabric begins to fray, creating a sense that everything is at stake. Friedman, from a structural perspective, reaches a similar conclusion, arguing that the final stage of both institutional and socioeconomic cycles is characterized by rising internal strain, dysfunction, and a growing perception that the system itself is unstable. In both frameworks, this environment carries a persistent sense that conflict is no longer theoretical, but increasingly probable.
From an anecdotal perspective, the parallels to prior periods of instability are difficult to ignore. The late 1960s were marked by political violence, race and social unrest, and a sharp decline in institutional trust—highlighted by the assassinations of President John F. Kennedy, Martin Luther King Jr., Robert F. Kennedy, and John Lennon. Today, the underlying dynamics are familiar. Institutional trust remains low, political and social polarization is elevated, and events such as the attempted assassination of President Donald Trump, the killing of Charlie Kirk, and the killing of Brian Thompson underscore the fragility of the current environment.
Periods like this are often accompanied by a parallel search for unity and national identity. In the late 1960s, the Apollo missions served as a symbol of technological ambition and collective purpose during a time of internal strain. Today, the Artemis program reflects a similar dynamic—an effort to project capability, leadership, and cohesion in a more fragmented global landscape. Likewise, moments of national pride often take on greater significance during periods of uncertainty. The U.S. men’s hockey team’s victory over the Soviet Union in 1980—the “Miracle on Ice”—became a defining cultural moment during a period of geopolitical tension, and its modern parallel can be seen in the recent U.S. gold medal win over Canada, serving as a similar expression of national identity and cohesion in a more divided era.
At the same time, both periods are marked by significant technological transitions occurring alongside macro instability. The late 1960s and 1970s saw the early stages of computing and automation, while today’s environment is defined by the rapid rise of artificial intelligence and digital infrastructure. In both cases, innovation continues to advance, but its economic and societal impact unfolds unevenly, often amplifying rather than resolving underlying tensions.
6. Social Mood, Market Behavior, and A Shift to Volatile, Range-Bound Markets
If we are, in fact, in the midst of a Fourth Turning or the “storm before the calm,” what might that imply for financial markets if we use socioeconomic and history as our guides?
The Socioeconomic Theory of Finance holds that financial markets are not driven primarily by external events or economic data, but by collective social mood. According to this view, waves of optimism and pessimism originate within society and manifest in financial markets first, with economic trends, political shifts, and geopolitical events following as secondary effects. In essence, markets are not simply reacting to the news, they are acting as a leading indicator of society’s underlying psychological state.
If we extend the overlay of the graph referenced above from 1949 to 1966 forward to 1980, which marked the beginning of the current era, we see that equity markets moved largely sideways in nominal terms, with repeated cycles of sharp rallies and declines. Real returns, after inflation, were negative.
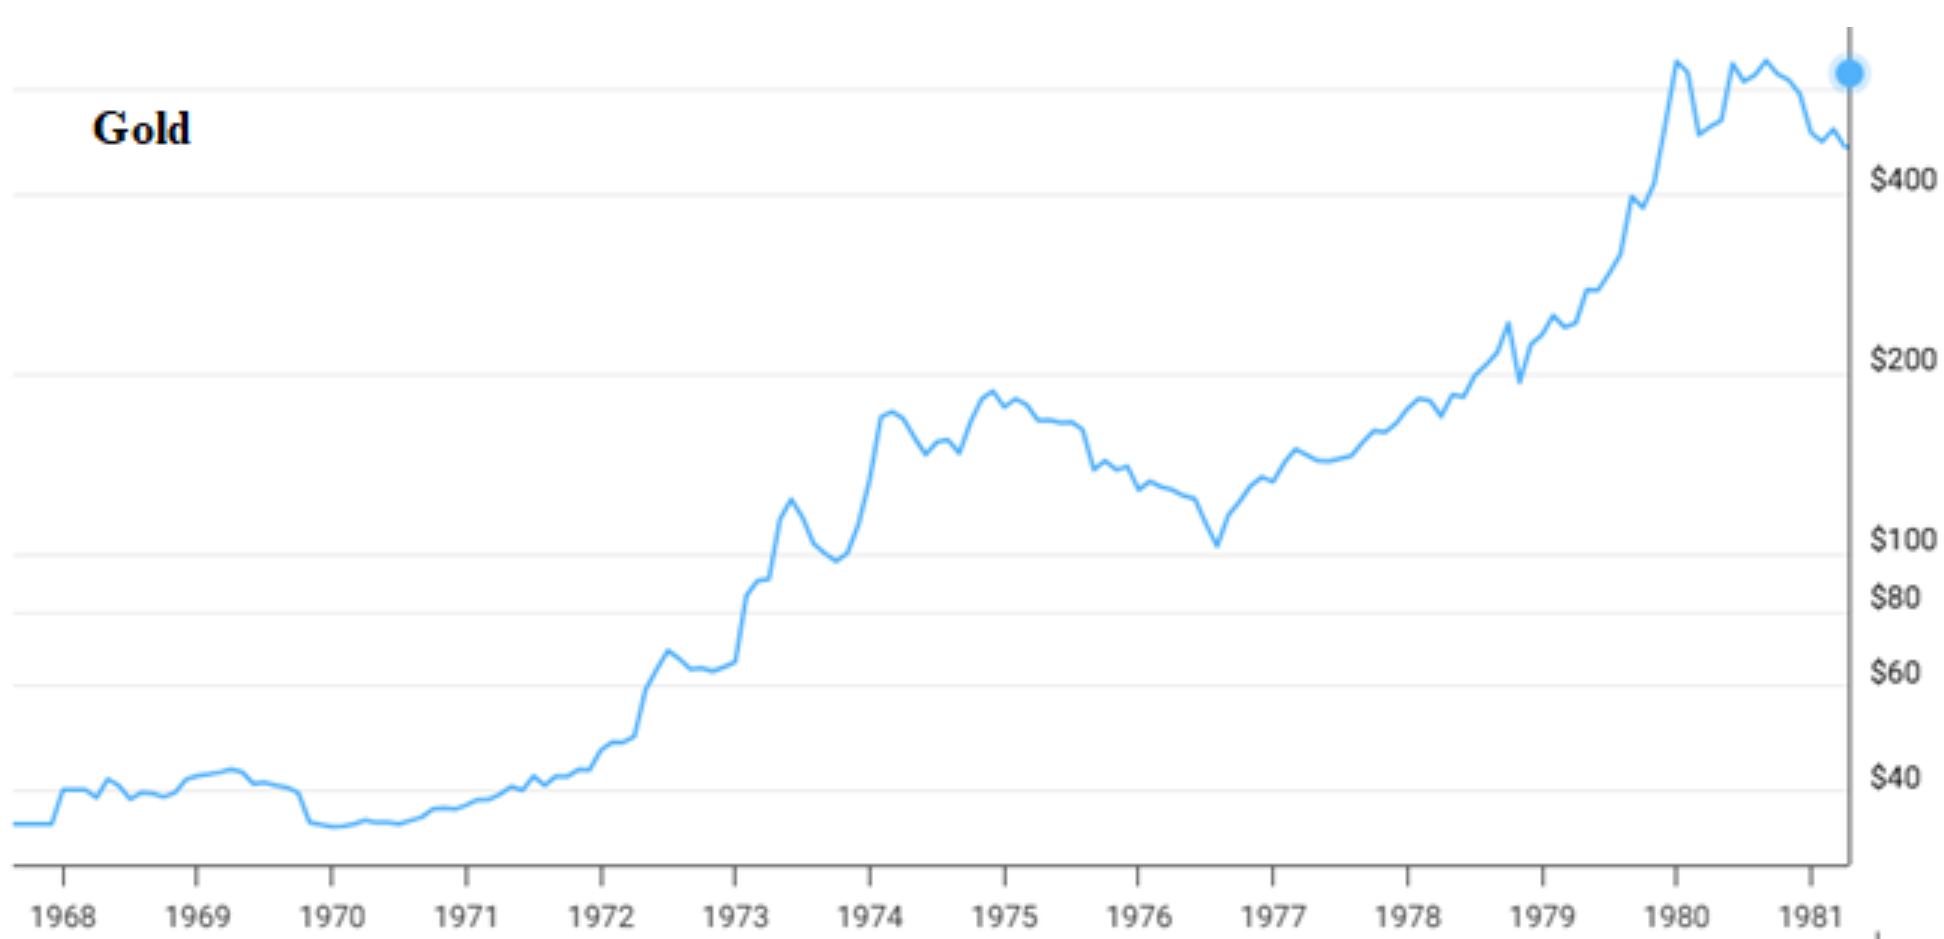
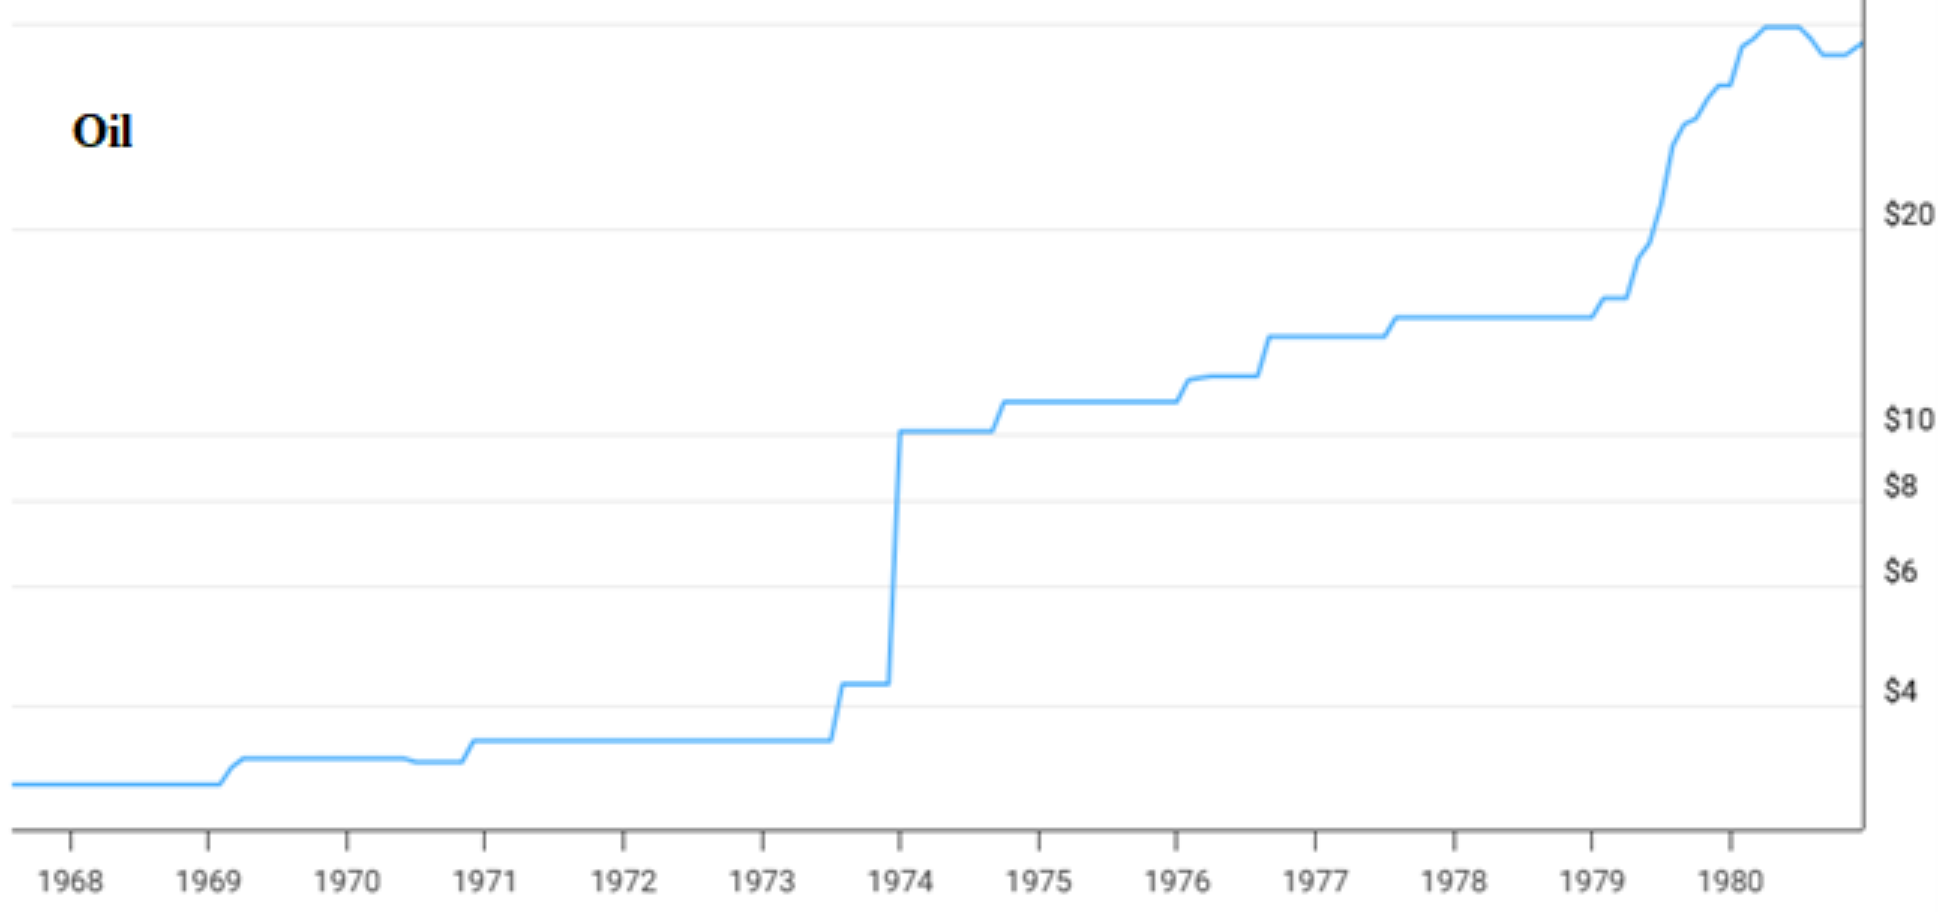
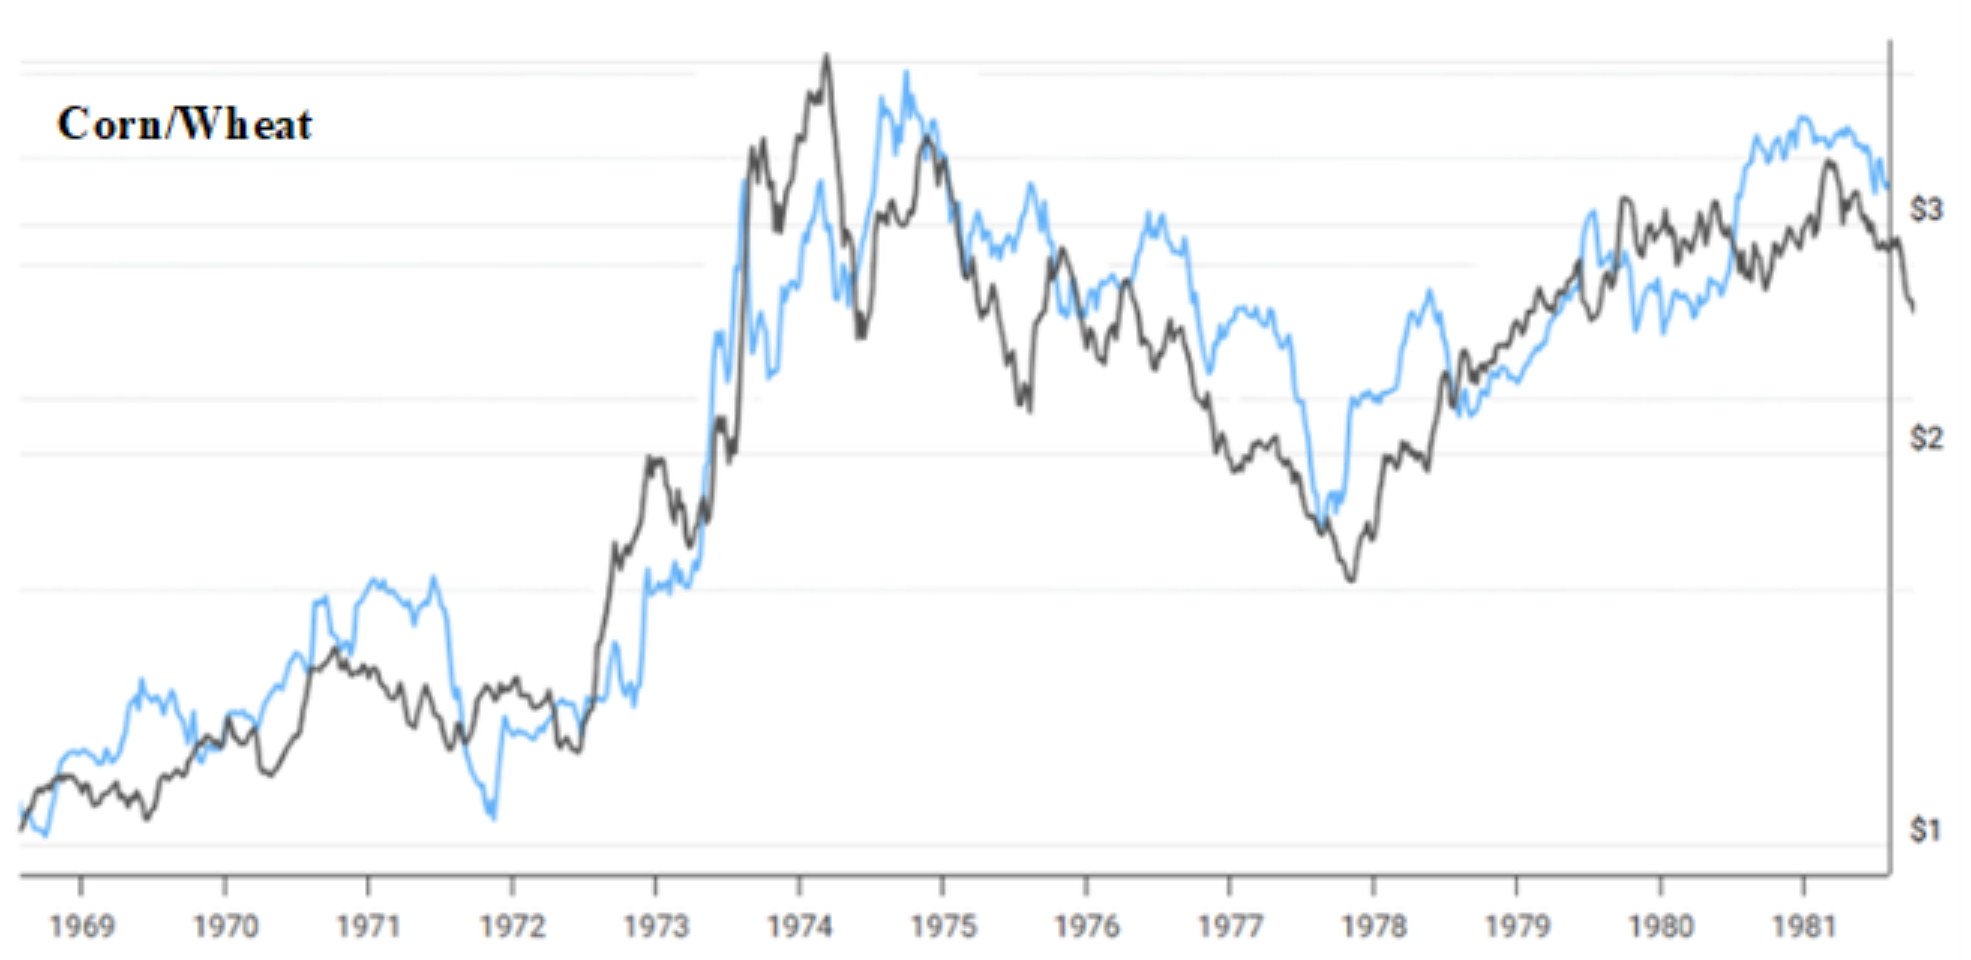
That said, there were sectors that outperformed—most notably commodities. Over the same period from 1966 to 1980, commodities, particularly oil, gold, food, and lumber, performed well as investors sought protection from inflation. Today, we are seeing renewed interest in real assets, including energy and metals.
Early signs of a similar environment are now emerging. Since 2022, markets have become more volatile, with sharp rotations across sectors and increasing dependence on liquidity conditions rather than underlying fundamentals. This suggests the potential for a renewed rotation toward hard assets during periods of monetary uncertainty.
Conclusion
The parallels outlined above do not suggest that history will repeat exactly. However, they do reinforce a consistent theme: we are in a period of transition, not stability. The pattern—financial repression and easy monetary policy, inflation shocks, geopolitical strain, oil crises, and stress within the monetary system—suggests that markets are less likely to trend cleanly higher and more likely to be shaped by cycles and socioeconomics.
Understanding where we are in that transition is critical. Positioning accordingly is what matters most.
2026 Q1 Individual Security Analysis for Avondale Large Models
Sound portfolio construction requires careful consideration of risk, return expectations, asset allocation, and the interplay between holdings. In this section, we outline the rationale behind any changes made over the past quarter—whether a new purchase, a reduction, a full exit, or a position increase.
Each decision reflects our ongoing evaluation of fundamentals, market conditions, and broader economic trends. We aim to ensure that every holding serves a clear purpose within the portfolio and remains aligned with our clients’ objectives and risk profiles. Transparency in this process is essential, and our goal is to provide a clear view of how and why we position portfolios the way we do.
Strategic Adjustments and Dynamic Allocation Across Models
Through the first quarter, our portfolios continued to hold an overweight position in equities with tilts towards the tech sector and small/mid-cap companies (as valuations continue to be attractive).
Position Additions & Subtractions: The following actions were taken in the first quarter
On January 28th the investment committed decided to swap our DoubleLine Total Return Bond Fund ( DLTNX) position for the JPMorgan Active Bond ETF (JBND). The decision was driven by JBND’s stronger historical performance, cheaper expense ratio, and a desire to move away from mutual funds on the bond sleeve of our portfolio.
Sources:
FRED: Federal Reserve Economic Data
Strauss, William, and Neil Howe. The Fourth Turning: An American Prophecy—What the Cycles of History Tell Us About America’s Next Rendezvous with Destiny. Broadway Books, 1997.
Friedman, George. The Next 100 Years: A Forecast for the 21st Century. Doubleday, 2009.
Friedman, George. The Storm Before the Calm: A Look at the Changing Global Order. Doubleday, 2019.
Prechter, R. R., Jr. Selected essays and white papers on the Socionomic Theory of Finance. Socionomics Institute / Prechter Publications.
All information herein has been prepared solely for information purposes, and it is not an offer to buy or sell, or a solicitation of an offer to buy or sell any security or instrument or to participate in any particular trading strategy. The views expressed represent the opinion of the Firm and should not be considered tax advice. For tax advice, please consult a CPA. The views are subject to change and are not intended as a forecast or guarantee of future results. This material is for informational purposes only. It is not intended to be investment advice or a projection of future investment performance. No one can foresee the future and, it is not a projection of the potential return of any investment, nor is it a projection of future inflation rates or the state of the world or domestic economy. Returns should not be considered a guarantee. Pie charts are target weights for Models and may deviate for market movements or specific client accounts.